How Google sees your online store: the Linka Style example
92 on mobile, 71 on desktop and 100 for SEO. Augustin Nicolau explains Linka Style’s results and how performance connects customer experience with Google.
Augustin NicolauADS Moldova founder
Contents
An online store needs to look good and respond quickly when someone searches for a product, opens a photograph or chooses a size. At Linka Style, we work on both: the presentation of a children’s footwear shop and the technical foundation supporting each visit.
The two PageSpeed Insights reports in this article show 92/100 for mobile performance and 71/100 on desktop. Both show 100 for accessibility, 96 for best practices and 100 for SEO. Starting with those results, I want to explain what we check, how performance relates to Google and why it matters to the person browsing the store.
Linka Style on mobile: a performance score of 92
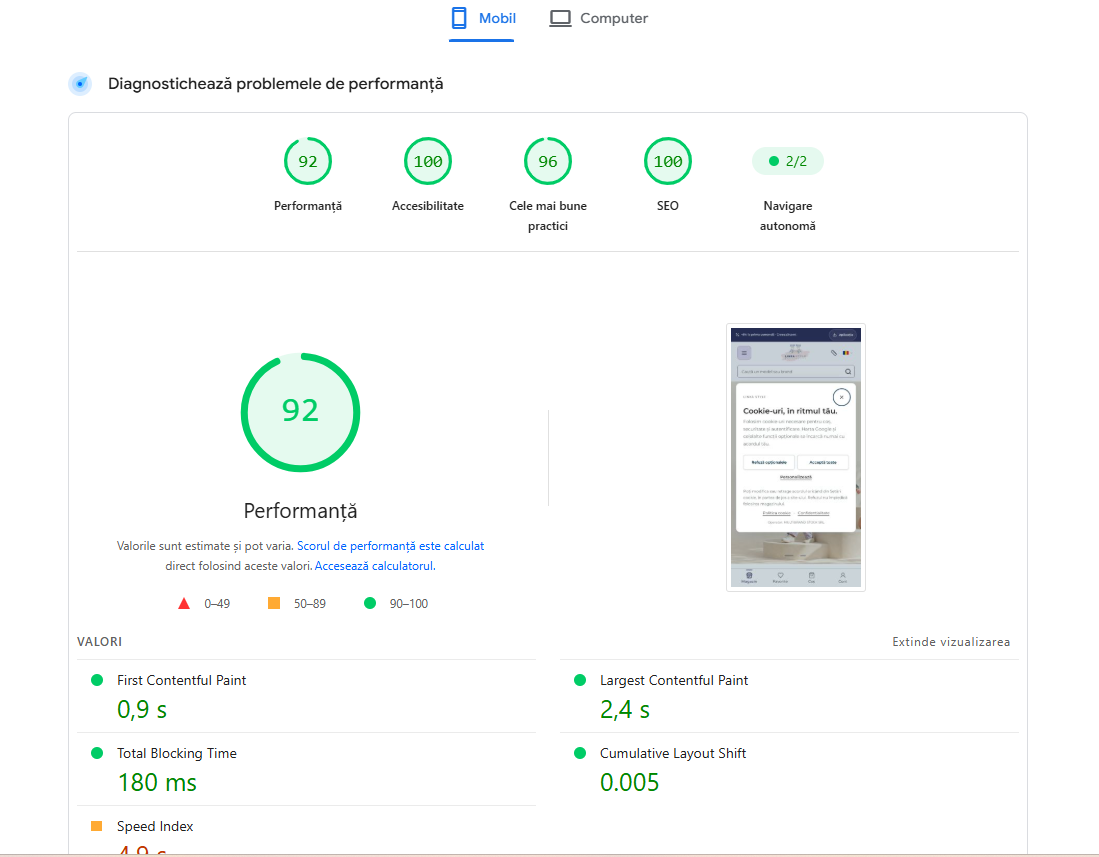
Linka Style · Mobile: performance 92, accessibility 100, best practices 96, SEO 100. FCP 0.9 s · LCP 2.4 s · TBT 180 ms · CLS 0.005. Original supplied screenshot.
Open the screenshot at its original sizeThe mobile report shows the first content appearing in 0.9 seconds, with the largest visible element loading in 2.4 seconds. Total Blocking Time is 180 ms, while Cumulative Layout Shift is 0.005. These are the values in the supplied screenshot, which you can also open at its original size.
For me, those numbers lead to ordinary questions. Can a parent quickly understand what the shop offers? Can they start searching without waiting behind an empty screen? Does a button stay where it was when the photograph arrives? A technical report becomes useful when it helps us discuss those details. Choosing a pair of shoes begins with an experience that feels understandable and responsive.
The desktop report: understanding the score of 71
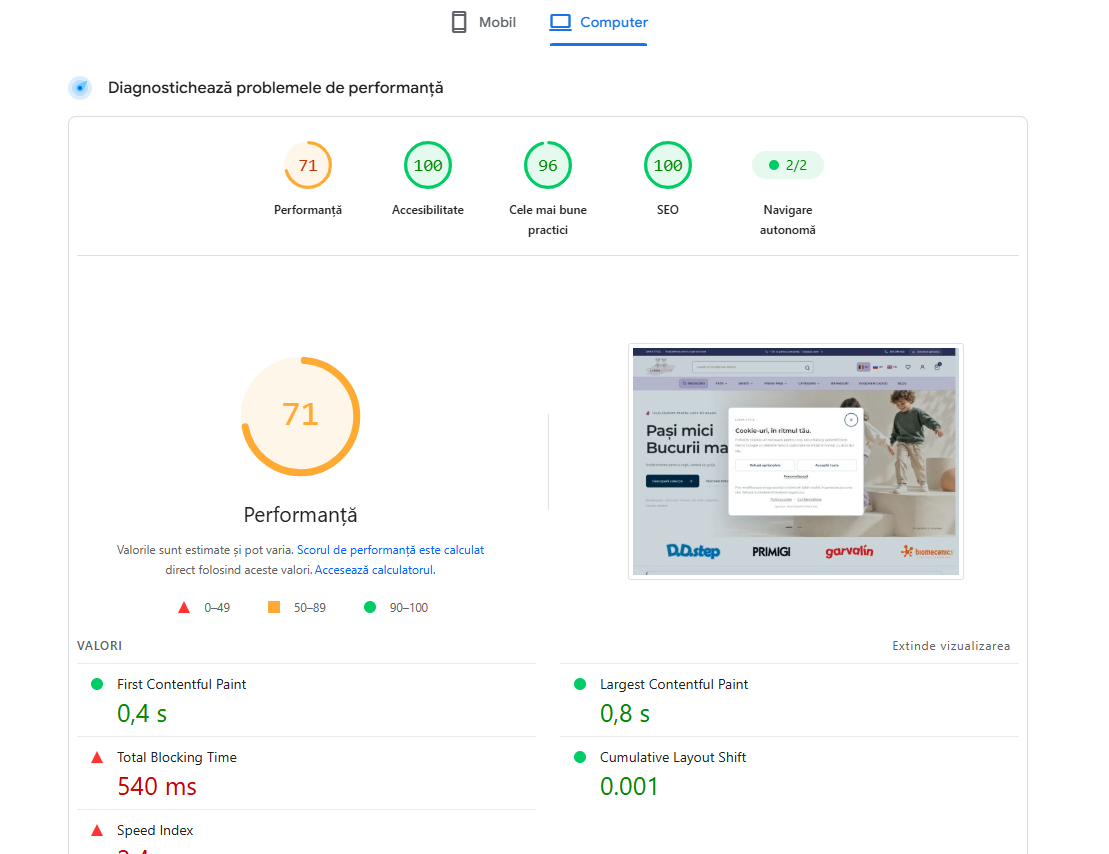
Linka Style · Desktop: performance 71, accessibility 100, best practices 96, SEO 100. FCP 0.4 s · LCP 0.8 s · TBT 540 ms · CLS 0.001. Original supplied screenshot.
Open the screenshot at its original sizeOn desktop, the first content appears in 0.4 seconds, and the largest visible element loads in 0.8 seconds. Layout stability has a value of 0.001. However, Total Blocking Time reaches 540 ms, and the overall performance score is 71/100. That is why we read the values underneath the coloured circle as well.
A page can show its content quickly while still doing substantial work in the browser. Lighthouse’s TBT documentation explains this measurement. For Linka Style, the desktop value gives us a direction to investigate. The screenshot alone cannot identify the responsible script or establish that a particular feature caused the blocking time. We need to examine the work before choosing a fix.
Why mobile and desktop receive different scores
The two tests operate under different conditions, and the final score combines several measurements. Google’s Lighthouse scoring methodology explains how those metrics contribute to the result. The overall number is more than the time needed to display the main photograph, so it should be read alongside the underlying values.
Linka Style illustrates this clearly: the desktop screenshot shows fast visual loading, while the higher blocking time affects the combined result. We use that observation to decide what to inspect next. The aim is to understand each version and improve its behaviour. Matching two numbers is less useful than identifying a concrete issue that matters to someone using the shop.
How Google considers a store’s page experience
When we discuss how Google sees a website, several questions come together: can it discover the page, understand its content and assess the experience it provides? Google Search Central encourages work on overall page experience. Performance forms part of that work, alongside useful information and a clear presentation of the offer.
For an online store, this begins with individual product pages, relevant titles, photographs and information that helps someone choose. Categories should lead towards suitable models, with speed supporting that journey. A strong technical result cannot replace product descriptions, the available range or relevance to a parent’s search. We therefore consider development and content together rather than expecting one technical setting to solve every discovery problem.
What 100 for SEO and accessibility means
Both screenshots show 100/100 for SEO and accessibility. These are useful results for the automated checks covered by the report on the tested page. They do not promise the top position in Google or replace checking the complete store with people. We use the scores as evidence about part of the technical foundation, then continue with practical review.
We read the text, open the menu on a phone, follow keyboard navigation and look for important information as visitors would. With children’s footwear, someone needs to understand size and the chosen model. Whether those details are easy to read and connect to the product decision deserves attention in its own right. A score cannot answer every question a customer has before choosing a pair.
Core Web Vitals: loading, responsiveness and stability
Core Web Vitals cover loading of the main content through LCP, responsiveness through INP and visual stability through CLS. They give us useful ways to discuss how comfortable a page is across different devices and connections, without reducing the whole experience to one number.
The Linka Style screenshots include laboratory LCP and CLS values, together with TBT. TBT helps investigate blocking work, but it is not the same measurement as INP. We also look at field data when it is available. That distinction helps us separate what happened during a particular test from behaviour that repeats in everyday browsing, and gives later decisions a more useful basis.
Why we check beyond the homepage
A customer may arrive from Google directly on a category or an individual pair of shoes. The homepage is only one entrance. Performance checks for a store therefore need to reach the pages where people compare products, change options and decide what interests them. Those pages may load different resources and offer different interactions.
At Linka Style, the catalogue, search, photographs and shop information each serve a purpose. As development continues, we check complete paths and different states: an available product, an empty search, an error message or longer text in another language. The store should stay understandable when its content differs from the example chosen for a presentation. These ordinary variations are part of the product, too.
What we examine before adding more features
We begin with important pages and problems we can reproduce. We examine photograph dimensions, when downloads begin, fonts, the code required for the first screen and external features. In the desktop report, investigating browser work is a sensible step before selecting a remedy. The process needs an observed cause, a focused change and another measurement under comparable conditions.
After optimisation, we return to the store itself: open the menu, use search, view products and check the available purchase steps. Useful information should remain available throughout that work. Performance improvements need to help both the customer and the team maintaining the catalogue. A better report is valuable when it supports the same task with a more comfortable and reliable experience.
Performance also matters after an advertising click
When preparing a store for Google Ads or Facebook Ads, we examine the destination page. An advert may create interest, but the store must continue the same message with a relevant product, clear photograph, price and understandable next step. The visitor experiences these stages as a connected journey.
A slow or awkward page can interrupt that journey. This is why we connect campaign preparation with website checks. The screenshots here do not contain sales or advertising costs: the result being presented is technical. We examine commercial outcomes separately through orders and correctly measured interactions once there is enough data. That lets us discuss what the store achieves rather than assigning revenue to a performance score.
A report helps us choose the next improvement
PageSpeed Insights provides laboratory diagnostics and, where sufficient data exists, information about real user experience. Google’s description of the tool explains those different parts. Scores can change between runs, so we preserve the captures and compare tests in similar conditions instead of selecting only the highest value we have seen.
Linka Style is live and still in development. These two captures document the stage shown here: a strong mobile result and a direction for further desktop work. For me, the useful outcome of a report is a concrete improvement to the store. It connects technical decisions with the way someone searches, compares models and finds the information needed to choose.
You can explore the whole project in the Linka Style case study. To understand your own store’s performance, start with our website performance service or send us its address. We will discuss the actual pages, observations and needs of your business.
Sources and documentation
Your notes
Notes stay in this browser.